

0
2018
0
2019
The Adjusted Recurring Earnings are calculated based on the Recurring Net Result for the period attributable to the holders of the Stapled Shares minus the coupon on the Hybrid Securities (from June 1, 2018).
0
2018
0 (1)
2019
(1) For the fiscal year 2019, paid on March 26, 2020
| FY-2018 (2) | FY-2019 | Growth | Like-for-like Growth | |
| Group Net Rental Income (Proportionate in euros Mn) | 2,161 | 2,491 | +15.3% | +3.0% |
| Shopping Centres (3) | 1,912 | 2,293 | +19.9% | n.m |
| France | 647 | 663 | +2.5% | +2.8% |
| Central Europe | 212 | 223 | +5.4% | +4.0% |
| Spain | 155 | 157 | +0.8% | +10.5% |
| Nordics | 141 | 123 | -13.3% | -2.6% |
| Austria | 108 | 111 | +3.5% | +2.5% |
| Germany | 140 | 143 | +2.8% | 0.0% |
| The Netherlands | 59 | 62 | +5.8% | +10.7% |
| Total Continental Europe | 1,462 | 1,483 | +1.4% | +3.1% |
| United States | 351 | 653 | n.m | |
| United Kingdom | 99 | 157 | n.m | |
| Offices & Others (4) | 149 | 103 | -30.9% | -1.2% |
| Convention & Exhibition (3) (4) | 100 | 95 | -4.7% | +3.4% |
| Group Earnings | ||||
| Recurring Net Result (Group share, in euros Mn) | 1,610 | 1,760 | +9.3% | |
| Recurring EPS (in euros per share) | 13.15 | 12.72 | -3.3% | |
| Adjusted Recurring EPS (in euros per share) | 12.92 | 12.37 | -4.3% | |
| EPRA Earnings (in euros per share) | 13.15 | 12.72 | -3.3% | |
| Group Valuation | ||||
| Total Portfolio Valuation (Proportionate, in euros Mn) | 65,201 | 65,341 | +0.2% | -1.8% |
| Going Concern Net Asset Value (in euros per share) | 233.90 | 217.50 | -7.0% | |
| EPRA Triple Net Asset Value (in euros per share) | 210.80 | 199.20 | -5.5% | |
| EPRA Net Asset Value (in euros per share) | 221.80 | 213.30 | -3.8% |
Group Net Rental Income(Proportionate in euros Mn)
FY-2018
2,161
FY-2019
2,491
Growth
+15.3%
Like-for-like Growth
+3.0%
Shopping Centres (3)
FY-2018
1,912
FY-2019
2,293
Growth
+19.9%
Like-for-like Growth
n.m
France
FY-2018
647
FY-2019
663
Growth
+2.5%
Like-for-like Growth
+2.8%
Central Europe
FY-2018
212
FY-2019
223
Growth
+5.4%
Like-for-like Growth
+4.0%
Spain
FY-2018
155
FY-2019
157
Growth
+0.8%
Like-for-like Growth
+10.5%
Nordics
FY-2018
141
FY-2019
123
Growth
-13.3%
Like-for-like Growth
-2.6%
Austria
FY-2018
108
FY-2019
111
Growth
+3.5%
Like-for-like Growth
+2.5%
Germany
FY-2018
140
FY-2019
143
Growth
+2.8%
Like-for-like Growth
0.0%
The Netherlands
FY-2018
59
FY-2019
62
Growth
+5.8%
Like-for-like Growth
+10.7%
Total Continental Europe
FY-2018
1,462
FY-2019
1,483
Growth
+1.4%
Like-for-like Growth
+3.1%
United States
FY-2018
351
FY-2019
653
Growth
n.m
United Kingdom
FY-2018
99
FY-2019
157
Growth
n.m
Offices & Others (4)
FY-2018
149
FY-2019
103
Growth
-30.9%
Like-for-like Growth
-1.2%
Convention & Exhibition (3) (4)
FY-2018
100
FY-2019
95
Growth
-4.7%
Like-for-like Growth
+3.4%
Group Earnings
Recurring Net Result (Group share, in euros Mn)
FY-2018
1,610
FY-2019
1,760
Growth
+9.3%
Recurring EPS (in euros per share)
FY-2018
13.15
FY-2019
12.72
Growth
-3.3%
Adjusted Recurring EPS (in euros per share)
FY-2018
12.92
FY-2019
12.37
Growth
-4.3%
EPRA Earnings (in euros per share)
FY-2018
13.15
FY-2019
12.72
Growth
-3.3%
Group Valuation
Total Portfolio Valuation (Proportionate, in euros Mn)
FY-2018
65,201
FY-2019
65,341
Growth
+0.2%
Like-for-like Growth
-1.8%
Going Concern Net Asset Value (in euros per share)
FY-2018
233.90
FY-2019
217.5
Growth
-7.0%
EPRA Triple Net Asset Value (in euros per share)
FY-2018
210.80
FY-2019
199.20
Growth
-5.5%
EPRA Net Asset Value (in euros per share)
FY-2018
221.80
FY-2019
213.30
Growth
-3.8%
(2) The Group’s accounts reflect Westfield’s activity only from June 1, 2018.
(3) In 2019, Les Boutiques du Palais was reclassified from France Shopping Centres to Convention & Exhibition (C&E). 2018 was restated accordingly.
(4) In 2019, the hotels CNIT Hilton, Novotel Lyon Confluence and Pullman Montparnasse were reclassified from Convention & Exhibition to Offices & Others (France). 2018 was restated accordingly.
EPRA PERFORMANCE MEASURES
0
2018
0
2019
The Adjusted Recurring Earnings are calculated based on the Recurring Net Result for the period attributable to the holders of the Stapled Shares minus the coupon on the Hybrid Securities (from June 1, 2018).
0
2018
0
2019
Net Asset Value adjusted to include properties and other investment interests at fair value and to exclude certain items not expected to crystallize in a long-term investment property business model.
0
2018
0
2019
Going concern NAV less the estimated transfer taxes and deferred capital gain taxes.
SHOPPING CENTRES
0%
2018
0%
2019
OFFICES
0%
2018
0%
2019
Annualised rental income based on the cash rents passing at the balance sheet date, less non-recoverable property operating expenses, divided by the gross market value of the property.
SHOPPING CENTRES
0%
2018
0%
2019
OFFICES
0%
2018
0%
2019
EPRA Net Initial Yield adjusted in respect of the expiration of rent free periods (or other unexpired lease incentives such as discounted rent periods and step rents).
SHOPPING CENTRES
0%
2018
0%
2019
Estimated Market Rental Value (ERV) of vacant space divided by ERV of total surfaces.
0%
2018
0%
2019
Administrative & operating costs (including & excluding costs of direct vacancy) divided by gross rental income.
SHOPPING CENTRES
0
2018
0
2019
Total amount of direct and indirect energy from renewable and non-renewable sources used by the shopping centres over a full reporting year, normalised by an appropriate denominator.
SHOPPING CENTRES
0
2018
0
2019
Total amount of direct and indirect GHG emissions generated from energy consumption in the shopping centres over a full reporting year, normalised by an appropriate denominator.
(5) See all EPRA KPIs in the Universal Registration Document.

Shareholder’s Report
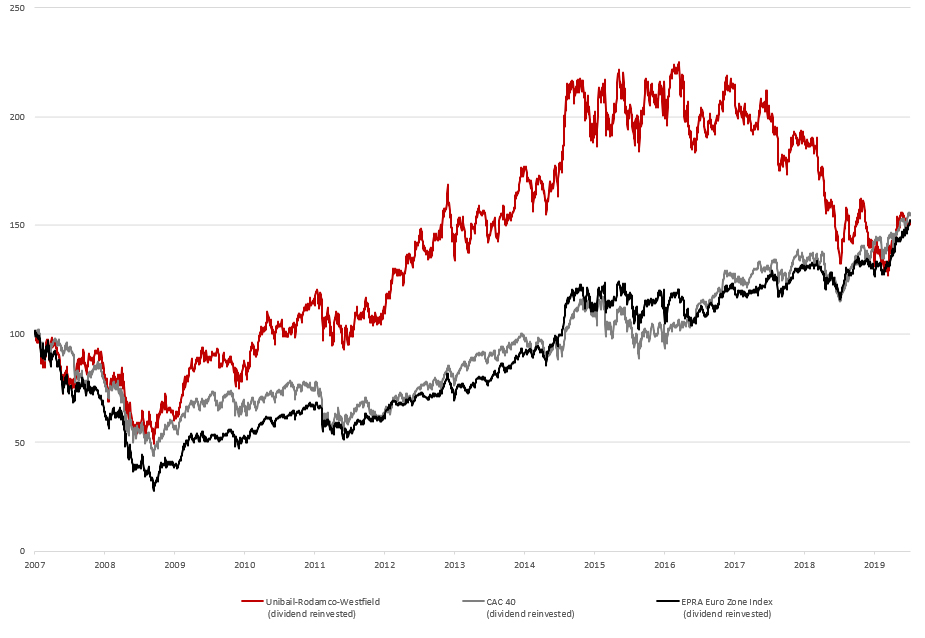
Relative performance of Unibail-Rodamco-Westfield's share
(Rebased to 100 at as June 25, 2007)
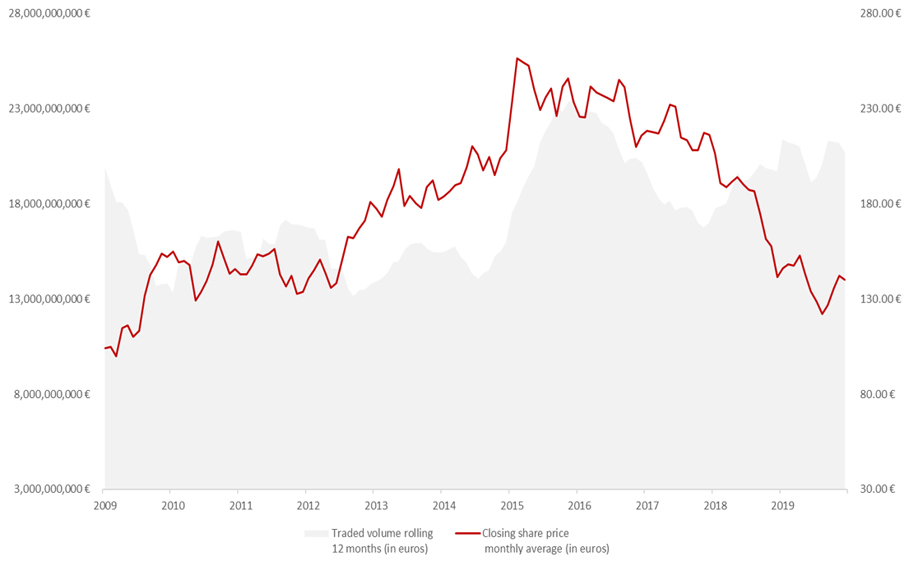
Traded volume rolling over 12 months & closing share price monthly average since 2009
(in euros)